Authors


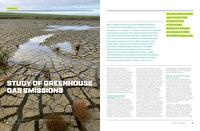
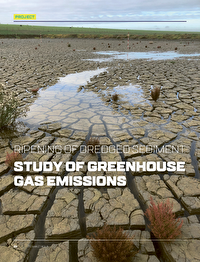
As increasing greenhouse gas (GHG) emissions contribute to global warming, it is becoming more important to consider the carbon footprint of hydraulic engineering projects. This carbon footprint is more complex than previously thought however, as it can also include the carbon dynamics of the sediments from which projects are built. The purpose of this study was to provide a first approximation from sediment-related GHG emissions of dredged sediments. Using the case study of the clay ripening pilot project (‘Kleirijperij’) in Groningen, the Netherlands, one phase of sediment processing was examined: the ripening of dredged sediments for use as a clay material in dyke construction.
Authors
When calculating GHG emissions from dredging and dyke infrastructure developments, the focus is on the emissions arising from operations and transport (e.g. fossil fuel combustion). However, the carbon stock concealed in ecosystem sediments, has the potential to be released as GHGs by dredging, drying, processing and further use. To date, these sediment-related GHG emissions arising from disturbance are often not accounted for in life cycle analysis (LCA) of hydraulic engineering projects. It also not known how much of the stored carbon is released via GHG emissions upon disturbance.
Clay ripening pilot project (‘Kleirijperij’): a win-win
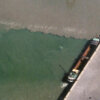
The aim of the clay ripening pilot project (‘Kleirijperij’) is to study innovative methods to transform locally dredged soft sediments into clay soil suitable for dyke construction. The pilot project monitored a range of physical and chemical characteristics over 2 years and assessed the suitability of the clay product for dyke construction. Two clay ripening pilots were constructed in the province of Groningen: Delfzijl and Kwelder, established in 2018 and 2020 respectively (Figure 1). Both pilot projects consisted of multiple test beds to test whether the conditions, such as the deposition layer thickness, the ploughing frequency and the presence of plants, aid the ripening process and eventually the clay quality. Ultimately, the finished ripened clay product will be used for the construction of the ‘Brede Groene Dijk’ (The Wide Green Dyke). Clay ripening from soft sediment is a form of beneficial use of dredged sediment. The Eems-Dollard estuary has to be dredged annually for transport purposes (mainly for the harbours of Delfzijl and Eemshaven) as well as ecological purposes. The high turbidity of the estuary is an ecological concern. Structurally removing approximately 1 million tonnes of sediment per year can have significant effects on this turbidity (Van Maren, 2016), which is a driver for larger scale future dredging. To evaluate large-scale use on land of dredged Eems-Dollard sediment in the future, several pilots are being conducted within the Eems-Dollard 2050 programme. The clay ripening pilot is one of them (Sittoni, 2019) and is executed by the Province of Groningen, Groninger Landschap foundation, Groningen Seaports, Rijkswaterstaat North Netherlands, water authority Hunze en Aa’s and the EcoShape foundation.
Figure 1
Location and overview of the clay ripening pilot projects in the Netherlands. (A) Delfzijl and (B) Kwelder (showing the salt marsh before sediment filling.

Ripening soft sediment to clay for dyke construction
The large quantities of dredged sediment can be beneficially used in a number of ways. One is the use of clay for dyke construction. In the Netherlands, there is a great need for high-quality clay to reinforce and raise dykes, in order to adapt to the challenges of climate change. Due to the demand, foreign clay is often imported. Costs of dyke clay and transport, in terms of market value, ecological degradation and the carbon footprint from foreign clay extraction and transport, suggests locally produced dredge spoils provide a promising alternative.
In order to be suitable for use as dyke clay, the estuarine soft sediment from the Eems- Dollard estuary (i.e. the sediment trap Delfzijl harbour for the clay ripening pilot Delfzijl and soft sediment deposits in polder Breebaart, deposited over the past 20 years) has to undergo maturation or ripening. This involves dewatering, desalinisation and degradation of organic matter. Desired targets are a pore water chloride content below 2.4 g L-1 and an organic matter content of below 5% (dry matter basis). To efficiently reach this composition, various strategies that may improve aeration and availability of labile organic matter were tested, such as aeration of the sediment through ploughing, flushing with freshwater prior to deposition in the test bed, and stimulating biological factors (i.e. plants and worms).
How ripening can result in GHG emissions
Coastal estuarine sediments are carbon sinks (Macreadie et al., 2019). Multiple conditions in the coastal estuary, including anaerobic (oxygen-free) conditions in sediments, result in this long-term storage. Dredging activities in the coastal estuary disturb processes both in these ecosystems and in the dredged material. This can result in the release of the stored carbon in the form of GHG emissions. GHG emissions are likely to vary depending on the dredging method, approaches to deposition and the composition of the dredged material. Oxygen is the key element that, when available, facilitates fast microbial degradation of organic carbon stored in the fine sediment. This results in loss of organic carbon as GHG carbon dioxide (CO2).
During and after dredging, GHGs escape from the dredged material as a result of microbial degradation of organic matter. Following dredging, increased availability of oxygen to the sediment speeds up the degradation process, resulting in the reduction of organic carbon content through increased CO2 emissions. There is a growing awareness that this source of GHG emissions might be significant for hydraulic engineering infrastructure projects (dykes, harbours, aquaculture, etc.) (Fiselier et al., 2018). However, few reliable measurements or assessments of GHG emissions due to ecosystem-derived carbon losses in hydraulic engineering projects are available.
In this study, we made a preliminary assessment of the carbon loss and resulting GHG emissions from dredged sediments during the clay ripening phase of a hydraulic engineering pilot project. Our goals were to illustrate an approach to assess carbon losses, GHG emissions and key processes involved. In the end, we hope to propose a framework for comparing emissions between different practical options.
Monitoring GHG emissions during the clay ripening pilot project
GHG emissions were measured in the first 3 months of the ripening of fine coastal sediments at the clay ripening pilot project Kwelder. Measurements were performed both in the field and in the laboratory. In March 2020, the clay ripening pilot Kwelder was established and filled with fine sediment.
This sediment originated from Polder Breebaart, a salt marsh area connected to the Eems-Dollard estuary and thus subjected to (dampened) tidal effects, which resulted in a net increase in sediment over the years. The material was removed using a cutter dredger and pumped at a low density (ca 1.05–1.10 kg/m3) to the mud ripener over ca 10 km, where it was deposited in ten test beds (K1-K10) (see Figure 2).
Figure 2
Schematic drawing (not scaled) of the test beds at ‘Kleirijperij Kwelder’ (K1-K10). Schematic overview (not scaled) showing placement of the respiration chambers in test bed K1 and K8. SK = Dewatering cistern. The photo on the right shows cylindrical respiration chambers for sampling greenhouse gases in the field, prior to placement.

Sampling sites to gather GHG emissions were carefully selected to contain fine sediments that made up the largest part of the deposit. These sites were far away from the entry location of the sediment, as mainly heavy particles (sand) settled near these locations. In two of these test beds (K1 and K8), GHG measurements were taken. These test beds were not treated by ploughing, desalinisation methods or introduction of plants. In each test bed, three sediment sampling points were selected and respiration flux chambers (see Figure 2) were installed. Measurements were performed in April and June 2020, 5 and 13 weeks respectively after deposition of the material.
To monitor GHG emissions in the field, flux chambers were closed for 4 hours to collect gas samples, which were later analysed in the laboratory. To support field measurements, sediment from both clay ripening pilot projects was incubated under controlled conditions in the laboratory to measure methane (CH4) production, by monitoring headspace CH4 concentration. For comparison, fresh salt marsh sediment (starting material in the Kwelder pilot), ripe salt marsh clay from the Delfzijl pilot and freshwater sediment (from a ditch) were incubated in parallel in the laboratory.
To analyse physical and chemical ripening in test bed K1 and K8, sediment samples were collected at three soil depths (10, 50 and 100 cm1) below the surface and analysed for electrical conductivity, pH, redox potential, bulk density (BD) and organic matter (OM) content. OM was analysed by loss on ignition with thermogravimetric pyrolysis (using the TGA-701 by Leco.).
1. In some analyses in the first period 75 cm.
Physical and chemical ripening of the clay
Over time, the fine sediments dried and consolidated to form a denser substrate. The shrinking, compaction and formation of cracks is clearly seen in the photos in Figure 3. Over the first 3 months, the moisture content decreased on average from 65% in April (±3% Standard Deviation (SD), over entire profile of 1 m) to lower values in June: 44% (±4% SD) in the top layer, 55% (±1.5% SD) in the intermediate layer and 39% (±2% SD) in the deep layer. Chloride and sulfate concentrations increased in the top layer due to evaporation of water. Electrical conductivity (EC) was used as a proxy for salinity and increased over ten times during the initial 3 months of ripening (April 10 ± 0.8 mS/cm; June 137 ±69 mS/cm).
Figure 3
Development of the ripening clay week 5 (A), week 13 (B) and week 35 (C).


Furthermore, the redox potential decreased, reflecting increasingly reduced conditions (average redox potential -62 ± 25 mV vs SHE2 in April and -162 ± 17 mV in June) and low availability of oxygen. Analysis of sediment along a depth gradient showed that after 13 weeks sediment was similar in terms of pH (range 7.3–7.5), temperature, EC (range of averages 137–199 mS/cm) and redox potential (range of averages 162–192 mV). All average values are based on six measurements per sediment layer.
2. SHE = Standard Hydrogen Electrode.
Figure 4
Mean (n=6) organic matter (OM) content of the ripening sediment in the Kwelder pilot in April and June for the different soil depths (10, 50 and 100 cm). Error bars represent SEM (Standard Error of the Mean).


Change in organic matter and field GHG emissions
There was a significant decrease in organic matter in the top layer of the ripening sediment (Figure 4). The OM content in April was highest in the top 10 cm and declined by 28% in 3 months (mean 12.5% in April and 9% in June). Nonetheless, the ripening clay from both pilot project sites was far from the dyke-clay standards’ desired 5% of organic matter content as a fraction of dry weight. No significant emissions of CH4 and CO2 were measured in the field (detection limit 0.15% CH4). This result was confirmed by closed bottle incubations in the laboratory (Figure 5).
Figure 5
CH4 concentration in the gas headspace of the incubation flasks in time. Bottles contained either freshly collected salt marsh sediment, ripe salt marsh clay or freshwater sediment from a ditch. Error bars indicate standard deviation (SD).


Anoxic conditions create high potential for methane (CH4) production. The physical and chemical data of the ripening clay showed that oxygen penetration was low and redox potential remained low from April to June in the entire sediment profile. The fact that no considerable CH4 emissions were observed from the clay ripening might be due to inhibition of CH4 production by high sulfate concentrations in the estuarine sludge. This results in more favourable conditions for sulfate-reducing microorganisms (that produce sulfide), rather than methaneproducing microorganisms. Sulfate reducers are known to outcompete methane-producing microorganisms under anaerobic conditions (Oremland and Taylor, 1975), resulting in limited CH4 formation. Similar results were found in laboratory measurements of methane emission in 120 ml flask incubations filled with 60 ml of fresh estuarine sediment, estuarine ripe clay and freshwater sediment. Methane emissions from estuarine sediment and clay were negligible, whereas methane emissions from freshwater sediment were significant (ca 1.22 μg methane (g wet weight) -1 day-1).
To conclude, for the period of this study we measured relatively limited decline in organic matter content throughout the sediment and low GHG emissions under the given field conditions. Factors that could be the cause for this are:
- our sampling methodology was not suitable for measuring the carbon emissions at the low levels that occurred in the test beds;
- organic matter breakdown by microbial activities is probably limited by limited supply of oxygen (or other electron acceptors); and
- despite favourable redox conditions, methane formation is probably limited because of sulfate reducing conditions.
The degradation of organic matter was studied at this pilot for a limited number of time points over the initial months following deposition and for only one ripening method. To illustrate organic matter degradation over a longer time and for alternative treatment options (e.g. ploughing, stimulated drainage and plants), we compare these to values for the organic matter content for the clay ripening pilot Delfzijl. At the pilot Delfzijl, ripening for 3 years resulted in limited reduction in in organic matter (less than 10% of the initial amount) (results not shown). This shows that also for the Delfzijl pilot, organic matter degradation remained limited during 2 years of ripening, and alternative methods of ripening did not show significant increase in degradation.
Potential GHG emissions based on changes in sediment carbon stock
Based on the decrease in organic matter concentrations, carbon stocks of sediments and the concomitant GHG emissions of the ripening process can be estimated. This is similar to many studies that have quantified carbon stocks of ecosystems, such as salt marshes and mangroves (Kauffman et al., 2020a; Kauffman et al., 2020b). This is the stock-change approach (SCA) that is also described in the Intergovernmental Panel on Climate Change (IPCC) as an approach to measure carbon stock losses and emissions.
In the current assessment, this SCA approach was performed for two scenarios:
- Scenario 1: This scenario represents the results obtained from the field. As described in the results section, transport of oxygen in the sediment and of GHGs out of the sediment was slow, resulting in a thin layer of sediment likely actively emitting GHGs. For this scenario, we assumed the organic carbon degradation values obtained from the clay ripening pilot Kwelder.
- Scenario 2: In this scenario, we assumed the clay to reach target values of organic matter content, which were set for the final stage of ripening of this sediment (5% organic matter of dry matter). Starting with 10% of organic matter content in the freshly dredged sediment, this equals a decrease of 5% organic matter loss. In this scenario, this loss of organic matter was assumed for the whole sediment mass. As illustrated with the 2-year data for the Delfzijl pilot, this organic matter degradation was not found in practice, despite efforts to reach the target by aeration through ploughing and the addition of plants. Therefore, this scenario represents a case scenario, not likely to be reached in practice in a short time frame of 2 years. As the Delfzijl pilot showed, even ploughing did not result in this degradation over 2 years.
Calculation
In order to calculate GHG emissions for the entire test bed for scenario 1, the data collected from specific sampling points and depths were assumed to represent certain depth ranges within the ripening sediment:
- 10 cm sediment samples: representative of the bulk density and soil organic matter at the 0–30 cm3;
- 50 cm sediment samples: representative of sediments at the 30–60 cm depth; and
- 100 cm sediment samples: representative of sediments at the 60–100 cm depth.
Organic carbon was determined from measured organic matter concentrations from the Kwelder pilot using a relation presented by Fourqurean et al. (2012) and Howard et al. (2014).
Y = 0.21 + 0.4X [1]
Where Y is organic C (%) and X = organic matter(%), r2= 0.87.
As is apparent through photos taken at the time of sampling, dramatic changes in soils between the different time periods were observed. In a period of less than 3 months, large cracks had formed in surface layers and a concomitant increase in soil bulk density was observed. Soil bulk density of the surface layers was 0.35 g/cm3 in April compared to 0.67 g/cm3 in the June. Similar responses were found at the middle depths (30–60 cm). Due to differences in the soil bulk density between time periods, comparisons of carbon stocks through examination of the same soil volume would yield incorrect estimations of carbon flux through time.
Therefore, to compare soil carbon stocks adequately, estimates were made using equivalent masses of the mineral soil fraction for April and June (Kauffman et al., 2016; Arifanti et al., 2020). The mineral soil mass is determined through subtraction of the soil organic matter density from the total soil bulk density. Then the total mass of the mineral fraction is determined for the top 100 cm of sediment in April, followed by calculation of the mineral soil mass for the June samples.
We assumed that losses in carbon stock were largely emitted in the form of CO2 rather than CH4, based upon our field and lab experiments and given the high salinity contents of sediments. Under this assumption, we report the ecosystem carbon losses as potential CO2 emissions, or CO2 equivalents (CO2e) – obtained by multiplying C values by 3.7, the molecular ratio of CO2 to C.
3. The depth range of 0–30 cm for the shallowest layer is probably an overestimation,
as visual observations made clear that the oxidised zone extended less deeply,
say 10 cm. On the other hand, the formation of cracks might propagate exchange.
Table 1
Estimated CO2 emissions per m2, per test bed and per tonne of clay for two scenarios.

Scenario 1: shallow and limited organic matter degradation (representing field data)
Based on the measured organic matter content for the different layers measured in April and June, a mean carbon loss between April and June was calculated of 2 kg C/m2. This corresponds to a mean potential GHG emission during the April to June clay ripening period of 7.7 kg CO2e m-2 of sediment (Table 1). Extrapolating to an entire single test bed (75 x 75 m or 5625 m2), we estimate the total emissions from a single clay ripening test bed was 43.1 tonnes CO2. The CO2e emissions from the entire ten ripening sites was 431.5 tonnes CO2e (Table 1). This comes down to 0.012 tonne CO2 per tonne of clay.
Scenario 2: deep, high (5%) OM degradation (desired quality)
This scenario assumed higher loss of OM (to 5%) across the whole depth transect of the sediment. As can be expected, the estimated CO2 emission in this scenario was significantly higher (27 kg CO2e m-2) than in scenario 1. In general, the CO2 emission will be proportional to the depth to which the organic matter will be degraded and the extent to which organic matter content decreases. There are currently no indications such a scenario is taking place when ripening sediment from the Ems-Dollard estuary4.
4. Evaluations are taking place to see if clay soil of a higher organic matter and salt levels can nevertheless be safely used in embankments.
Results
Given the small sample size, short sampling time and indirect measures of organic carbon, data and results must be viewed with caution, as there is a high degree of uncertainty. However, the results do suggest that carbon emissions from the clay-ripening process may be significant. Further investigation using accurate portable infrared gas analysers and intense sampling of sediment carbon pools during the entire clay ripening process is recommended in order to obtain more precise estimates of GHG emissions.
The differences in GHG emissions calculated for the two scenarios demonstrates the influence that environmental conditions, time and sediment management may have on the CO2 emissions. The depth and degree to which organic matter is degraded strongly determines the CO2 emission, and is likely strongly dependent on ripening strategy (e.g. ploughing and influencing salinity) as well as the carbon quality of the sediment organic matter. Thus, the different ripening strategies would influence the rate and quality of CO2 emissions. Furthermore, with the laboratory incubations, we demonstrated a much higher GHG emission from freshwater sediment compared to saltwater sediment. Therefore, the choice between saltwater and freshwater sediment can also strongly influence sediment-related GHG emissions, as the production of CH4 and consequently the emission of GHG is most likely much higher in freshwater sediments.
To put the numbers calculated here into context, it is useful to compare these to potential alternatives. For building dykes, an alternative source of dyke clay is the import of freshwater sediment from Belgium or other parts of the Netherlands, low in organic matter. An important component of the GHG emission related to this alternative is the emission due to fossil fuel combustion. An estimate can be made of this emission based on known numbers (www.co2emissiefactoren.nl). The GHG emissions of a truck (weighing 10–20 tonnes) is estimated to be 0.256 kg CO2/tonne kilometre (well-to-wheel). When we assume one-way transport of a loaded truck over 200 km (from Belgium to the pilot locations), this leads to an emission of: 200 km * 0.256 kg CO2/tonne kilometre = 51.2 kg CO2/tonne clay or 0.05 tonne CO2/tonne clay.
This comes down to the same order of magnitude as the GHG emissions from the clay ripening process under the worst-case Scenario 2. Actual emissions from transport will be higher, as we did not take into account other activities, and only included one-way transport. In general, these calculations should be seen as a first estimate to illustrate the methodology; for a complete comparison, emissions from several activities in both scenarios should also be taken into account.
Discussion
The urgency of all business sectors to address climate change mitigation through reduction of emissions and the sequestration of GHGs is well recognised. If we are to attain the target of the Paris Agreement, all stakeholders must act. In line with this, the Dutch government aims to reduce the Netherlands’ greenhouse gas emissions by 49% by 2030, compared to 1990 levels, and a 95% reduction by 2050. In addition, the Dutch Ministry of Infrastructure and Water Management adopted a target to achieve net-zero emissions by 2030. Companies in the maritime and dredging sector have started to adopt net-zero targets. This has already resulted in serious efforts to minimise emissions from hydraulic engineering, particularly in relation to minimising use of fossil fuels and optimising construction materials. The presented analyses in this study demonstrate a useful methodology and indicative numbers for sediment-related GHG emissions, however, many uncertainties remain that deserve further attention. Improved approaches to the sampling of GHG emissions and quantification of the carbon mass within the sediments would facilitate accurate quantification of carbon stocks and GHG emissions from the ripening process.
Direct measurements of GHG emissions are needed to confirm the findings and validate the range of applicability both in the field and in the lab (i.e. Gebert et al., 2019). The use of portable infrared gas analysers would facilitate accurate field measures of trace gas emissions (CO2, CH4, N20). Furthermore, intense sampling of sediment carbon pools during the entire clay ripening process is recommended to obtain more precise estimates of GHG emissions from the clay ripening process. This would entail repeated sampling of carbon concentrations and concentration bulk density at varying depths of the sediment beds over time.
The carbon composition and quality are also unknown. The carbon quality is a measure of the quantity of labile and recalcitrant fractions. This is important as microorganisms can readily decompose labile forms while recalcitrant carbon may indefinitely persist in sediments. Knowledge of carbon quality provides information on the time required and potential to reduce organic matter in dredged sediments. In addition, other components of the sediment, such as clay and salt, may have an impact.
Once salts are washed out of the clay and with greater oxygen penetration (via plant roots, bioturbation or after soil is mixed with sand), the degradation of the organic material will be enhanced. However, this could increase methane emissions, which would increase the global warming potential of the gases arising from this ripening process. The sediment in the two pilot projects described here is both estuarine, salt-water sediment from the same region, which could differ in several more specific parameters such as organic matter quality. For other cases, sediment properties (such as organic matter quality, salinity and clay content) might be different and it is recommended to take this into account.
If the objective of a project involving hydraulic engineering is to minimise GHG emissions or even sequester carbon, then building with nature based solutions can be applied, such as using the soft sediments for salt marsh creation where vegetation could uptake CO2 and store organic carbon in sediments. Salt marshes not only sequester carbon but also reduce wave heights. When dykes are combined with vegetated foreshores, they can be lower and still provide safety (Temmerman et al., 2013). Lower dykes require less clay and thus involve fewer emissions from clay ripening.
In this pilot study, we only focused on processes during the first stage of the ripening of the sediment and a transition from dredged sediment to clay material. Microbial degradation of organic carbon will result in loss of this organic carbon as CO2 and/or CH4. Our pilot study already suggested some parameters that affect the sediment-related GHG emissions during ripening of soft sediments: the concentration of organic carbon in the sediment, the quality of that carbon and the salinity that affects whether emissions will be limited to CO2 or not. The slow transport in and out of the sediment probably also affects degradation conditions, resulting in low availability of oxygen and slow breakdown of organic matter and slow emission of greenhouse gases.
These and other factors might differ with different dredging methods and ways of deposition during ripening. However, there are many process steps before and after the ripening period in the project where GHG emission estimates are still lacking, therefore more research on this topic is needed. The entire life cycle analysis, including the carbon losses and sediment-related GHG emissions from pre-dredging up to the moment the clay has been implemented in the dykes and the further fate of carbon, should be quantified. Finally, the use of relevant reference scenarios in the life cycle analysis is essential, e.g. of natural ecosystems or alternatives of the sediment use.
Conclusions
Our study aimed to assess GHG emissions from ripening soft sediment to dyke clay and to identify key processes involved. Given the small sample size, short sampling time and indirect measures of carbon loss, our results must be considered as a first exploration. The estimated CO2 emissions suggest that carbon emissions from the clay ripening process are potentially significant and that these emissions can be affected by the type of sediment and ripening conditions. Emissions from clay ripening ranged between 0.012 tonne CO2e/tonne of clay for our short-term field experiment up to 0.05 tonne CO2e/ tonne of clay if the desired clay quality with an organic matter content of 5% would be reached. Alternatively, if a similar amount of clay would have been collected from abroad, GHG emissions from transport alone may equal these emissions.
The results from this study offer an approach to compare GHG emissions from soft sediments to alternatives and give information on control parameters by which GHG emissions from soft sediments can be minimised. Firstly, working with saline sediment it is less likely that organic matter is converted to CO2 instead of into the more potent greenhouse gas CH4 than working with freshwater sediment. Secondly, gas exchange between sediment and atmosphere can be limited, minimising GHG emissions directly, and indirectly by maintaining anaerobic conditions. However, for freshwater sediments anaerobic conditions may stimulate emissions of the much stronger GHG CH4 . Minimising gas exchange works against the aim to reduce the organic carbon content in the sediment to 5%. Therefore, studies are performed with ripened to see whether saline clay with a higher than desired OM content (>5% OM) is affecting dyke building strength.
We recommend that sediment-related emissions are addressed in life cycle analysis (LCA) of hydraulic engineering projects, so that different options can be properly compared and well-informed decisions can be made. To achieve this, GHG emissions from and carbon sequestration in sediments need to be integrated into existing tools, such as the ones used by the Dutch government ‘DuboCalc’ or the ‘CO2 performance ladder’. Meanwhile, hydraulic engineering projects that involve soft sediments should measure and report carbon stocks and fluxes of GHGs to build up the required knowledge base.
Authors

Femke Tonneijck

Femke leads Wetlands International’s global programme on wetland carbon. She coordinates efforts to mitigate climate change by implementing and advocating for nature-based solutions in close collaboration with governments, knowledge institutes, private sector, NGO’s and communities. She strives to connect science, policy and practice to create a world in which nature and people exist in harmony. She holds a PhD in Physical Geography with a focus on soil carbon dynamics.
OTHER ARTICLES BY THIS AUTHOR
PDF download
Download the PDF version of this article with high resolution pictures and layout.
Single-page view
Two-page view