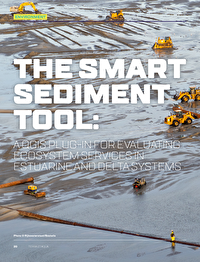
Managing sediments, especially from dredging, is important for the management of estuaries and coastal areas. When implemented in the right way, a sediment management strategy can be qualified as a nature-based solution as it uses the physical processes of erosion and sedimentation to create added value. There is a need for an evaluation of sediment strategies and the habitats that are created for a wider range of objectives than only biodiversity and nature conservation. The concept of ecosystem services provides this broader framework.

Practical tools to assess the ecosystem services effects of sediment management are not yet available. We have developed a QGIS plug-in that enables a first evaluation of the impact of sediment management on ecosystem services. Knowledge of ecosystem processes and their relationship with ecosystem services was used to develop quantification methods (e.g. for food production, water quality regulation, climate regulation and recreation). With the Smartsediment Ecosystem Services QGIS tool, Smartsediment tool for short, users can assess ecosystem services in an estuary and compare scenarios with different sediment measures or developments. The result gives an indication of how many – quantitatively, from calculations based on expert knowledge – and where – spatially explicit in GIS maps – ecosystem services are created. The practicability and validity of the tool were tested on a series of sediment management strategies in the transboundary Scheldt delta (project website www.smartsediment.eu).

With the Smartsediment Ecosystem Services QGIS tool, users can assess ecosystem services in an estuary and compare scenarios with different sediment measures or developments.

Sediment management for ecosystem services

Sediments form an essential, integral and dynamic part of our river, estuarine and coastal systems, where they determine both patterns such as habitats and processes such as erosion and sedimentation. Human interventions such as dredging, disposal and sand mining, but also alterations in the hydrodynamics, influence the sediment household of water bodies. This can benefit certain goals such as improved navigation but also affect patterns and processes, positively and negatively, in the specific natural system. There is a noticeable shift to sediment management strategies that are more integrated with the needs of other user functions such as the disposal of dredged material to create valuable habitats. The benefits of these strategies on ecological objectives for habitats and species are studied during design and legally required evaluation procedures. However, the creation of habitats also benefits other objectives than biodiversity. In this paper, we try to explore and unravel with which relations between sediment management and Ecosystem Services (ES) an evaluation of all benefits for society can be made.

Figure 1

Ecosystem Services (ES) cascade framework, showing ES as the link between the ecological system which consists of ecosystem properties with certain ecosystem functions, and socio-economic systems with needs and benefits for society with a certain value (Boerema et al., 2017).

The concept of ES was mainly founded by the Millennium Ecosystem Assessment (MEA, 2005) and The Economics of Ecosystems and Biodiversity (TEEB, 2010) and are defined as the benefits that humans derive from nature. There are different types of ES with different benefits for human well-being. The Common International Classification of Ecosystem Services (CICES, 2020) defined three categories: provisioning (e.g. reared aquatic animals for nutrition, surface water used for energy), regulating and maintenance (e.g. regulation of soil quality, regulation of baseline flows and extreme events), and cultural (e.g. physical and experiential interactions with natural (a)biotic components of the environment).

The ES cascade framework illustrates the link between the ecological system and the socio-economic system (Figure 1). The ecological system consists of biophysical structure or ecosystem properties (EP) and any change or reaction which occurs in an ecosystem, being the ecosystem functions (EF). Due to the functioning of the ecosystem, ecosystem services are created and hence it benefits human wellbeing (B). This change in wellbeing brings with it certain (non-)economic value for society (V).

Sediment management is an important tool for management of estuaries and coastal areas.

At a global level, ES are becoming part of important programmes since 10-15 years. Researchers and others recognise that healthy and sustainable ecosystems are critical for the Millennium Development Goals, more recent Sustainable Development Goals, since they are the source of natural resources that are essential ingredients for human survival and the ‘fuel’ and building blocks for human wellbeing and economic development (MEA, 2005; UNEP, 2009). Furthermore, the use and restoration of ES is being recognised by UN-Water (2014) to be an effective and cost-saving alternative to conventional infrastructure such as wastewater treatment plants or dykes for flood prevention. Since 2012, the independent Intergovernmental Science-Policy Platform on Biodiversity and Ecosystem Services (IPBES, 2012) has had an important role globally in strengthening the science-policy interface for biodiversity and ES for the conservation and sustainable use of biodiversity, long-term human wellbeing and sustainable development. IPBES is currently working on the rolling work program up to 2030 to advance the achievement of the overall objective of IPBES. This 2030 work program corresponds with the 2030 Agenda for Sustainable Development, including the Sustainable Development Goals, the biodiversity-related conventions and other biodiversity and ES processes.

Roggenplaat

The Smartsediment tool

Sediment management, including dredging, sand extraction, sediment disposal and nourishments, is an important tool for management of estuaries and coastal areas. Changes are induced in the water-sediment system on both on short temporal and small spatial scales, such as with sand bar nourishment and long temporal and large spatial scales, such as influencing the tidal range). The resulting geomorphological changes, on all scales, affect a variety of coastal and estuarine ES. For the specific context of dredging and marine constructions, the application of ES is acknowledged to demonstrate benefits of such projects to human welfare and the environment (CEDA, 2013 and PIANC, 2016). Yet, ES are often not considered in projectrelated cost-benefit analysis because there are no tools or practical guidance. We address three major challenges that should contribute to a better uptake of ES in project development:

  • indicators to quantify ES based on state-of-the-art system understanding; • spatially explicit assessment to account for local and system-wide effects; and
  • the temporal context of effects.

These are three important aspects for a sound ES assessment, which can be used as input for an environmental impact assessment, societal cost-benefit analysis and costeffectiveness analysis. GIS tools can enable project managers to make a first evaluation of the ES delivery of the estuarine or coastal system they are interested in. Furthermore, with such tools a comparison can be made of different strategies or project designs, including spatially (using maps). It should be possible to use local knowledge and data as much as possible. In this paper, we present the development of the Smartsediment tool that tries to address all three aforementioned aspects. The tool is based on a conceptual model to unravel impact-effect pathways. It builds on ECOPLAN-SE, a spatial decision support system to assess a wide range of ecosystem functions and services on land (Vrebos et al., 2020).

Development of the Smartsediment tool, a QGIS-tool to evaluate ecosystem services

Four steps are needed to develop an instrument that addresses the three challenges outlined. The aim is to develop a spatially explicit tool to calculate effects of sediment management strategies on ES. The tool was developed and tested for the transboundary Scheldt delta in the frame of the EU Interreg regional Flemish-Dutch project Smartsediment (www.smartsediment. eu/english).

Step 1: Selection of relevant ES

When evaluating the ES within a management context, considering all possible ES is difficult, time consuming and unnecessarily expensive. Therefore, a selection of the most relevant ES should be made. However, it is important to include a broad range of ES covering provisioning, regulating and cultural ES. Therefore a structured procedure to select the relevant ES is required. Starting from a long list of ES based on the Millennium Ecosystem Assessment (MEA, 2005), The Economics of Ecosystems and Biodiversity (TEEB, 2010) and the Common International Classification of Ecosystem Services CICES (Haines-Young and Potschin, 2013), ES that are identified specifically for estuaries and the marine environment were added to this list (Barbier et al., 2011, Liquete et al., 2013, Turner and Schaafsma, 2015, Bohnke-Henrichs et al., 2013, Jacobs et al., 2015). Next, this list of ES was screened by experts to select those that depend in some way on sediment and can potentially be affected by sediment management. Previous work on ES in the context of sediment management, dredging and port activities was also consulted (Apitz, 2012, Brils et al., 2014, van der Meulen et al., 2016, Boerema et al., 2016b and PIANC, 2016). The following ES were selected:

  • aquatic animals for nutrition such as crustaceans, shellfish and fish; • substances used for materials such as sand;
  • mediation of wastes contributing to the regulation of water quality;
  • regulation of baseline flows and extreme events;
  • physical and experiential interactions with natural environment (e.g. shoreline recreation, swimming, recreational navigation);
  • habitat protection for seals and birds; and
  • additionally, effects on the navigation potential of the river.
Figure 2

Smartsediment conceptual model, which is used to unravel impact-effect pathways. The top row shows the global concept: sediment management strategies intervene in the overall ecosystem structures and functions which results in effects on nature and society (ecosystem services). The bottom zooms in on the complex relationships that are taking place within the ecosystem. Consequently, an intervention such as sediment nourishment results in a direct effect on the morphodynamics of the ecosystem, but through the processes between hydrology, morphology and ecology many indirect impact-effect relationships occur with effects on e.g. food production because of changing fish feeding habitat, and water quality regulation because of changing water turbidity.

Step 2: Conceptual model to unravel impact-effect pathways

How do specific sediment management strategies affect the functioning of the coastal zone and hence on the delivery of ES? Different impact-effect pathways can exist between the management strategy, the functioning of the coastal zone and ES. To unravel these pathways, a conceptual model representing the relationships ‘how does the world work’ was developed.

This conceptual model provides an analytical framework to give insight in the effects of sediment strategies on ecosystem functioning and on the selected ES (Figure 2). The estuarine ecosystem is divided in the soil, water and air components. The interaction between hydrodynamic and morphodynamic processes such as water flow, sedimentation and erosion forms the basis of the system structure. In addition to that, soil and water quality aspects such as nutrients, oxygen, organic material, primary production and detritus, form the basic food cycle in the system. On top of that, the food web can develop with higher trophic levels. This conceptual model is used to depict impact-effect pathways. First, the main direct and indirect effects of sediment management strategies on the functioning of the system are identified. Next, the functions of the system should be linked to the different ES. The latter step requires insight in the underlying ecosystem processes that form the basis for the delivery of the ES. Direct effects are related to:

  • changing the local morphodynamics by dredging or disposing sediments;
  • changing the local sediment characteristics by disposal of new material with different sediment composition and grain size;
  • changing the water quality by dredging and disposal which can cause more turbidity when fine sediment ends up in the water column; and
  • temporal visual or auditory disturbance during the project which can affect higher biota such as seals, porpoise and fish.

Direct effects could be linked to ecotopes. Ecotopes are a classification system based on the smallest ecologically distinct landscape units with relatively homogeneous, spatially explicit abiotic landscape characteristics such as a typical depth and water velocity. Ecotopes have distinct characteristics and can therefore be considered representative for other functions and for the delivery of particular ES. It provides a practical solution for a rapid assessment, which might be needed in an early project phase when one is interested in a high-level comparison of different scenarios. In a later stage, for more detailed assessments of different designs, more detailed local information is required, which goes beyond the simple ecotope approach. This is similar with the habitat approach, which is often used in ES studies, but ecotopes are limited to units based on abiotic parameters only. Biotic parameters should be considered in addition, as these are more local specific and hence less straightforward to be considered as representative.

Figure 3

A schematic representation of the analysis.

Besides the more obvious direct effects, also indirect effects should be considered (Figure 2). Potential indirect effects are very diverse and linked to the entire ecosystem functioning. Hydrodynamic conditions can change due to morphodynamic changes because of their strong interactions. Changes in hydrodynamic and morphodynamic conditions can result in changes in the presence and characteristics of ecotopes. Changes in hydrodynamic and morphodynamic conditions can also affect suspended matter, which is linked to water quality. Due to changes in water velocity, flow direction and sediment characteristics, more sediment can get in suspension or suspended matter can decrease in case more sediment is trapped under the new situation. Furthermore, changes in hydrodynamic and morphodynamic conditions and soil and water quality affect biotic conditions such as benthos, birds, fish and shellfish, seals.

Step 3: Calculation methods

The most challenging part is the quantification of the impact of sediment management on ES. The tool translates changes in the ecosystem such as flow velocity, sediment type and access for recreational activities into changes in the delivery of specific ES. The calculation methods per ES are based on ecosystem knowledge from the Scheldt delta and similar north-western European deltas and specific studies that investigate management effects. To develop the calculation methods for each ES, a balance had to be found between representing the complex reality and the ease of use. The necessity of input parameters and ease of implementation in the QGIS tool, to name a few, had to be considered. Therefore, for some ES two quantification rules were foreseen, one more advanced and one simpler. Obviously, the simpler method, based on fewer parameters, is less precise. All calculation rules and necessary input data are described in detail in the user manual (De Swerdt et al., 2020).

An example is the ES climate regulation that relates to carbon capture and storage/CCS, expressed in CO2. Two calculation methods are available in the Smartsediment tool. The first method is simple and uses the mean value for CCS for different ecotopes based on expert knowledge and literature (Boerema et al., 2016b). Based on the different ecotopes and their average CCS values, a total amount of CCS for the area of interest in calculated. Salinity is also taken into account with three categories: salt, brackish and fresh. For the Scheldt estuary, a salinity map was added to the underlying model and therefore does not need to be added by the user. The second method is more advanced and foresees a calculation of CCS based on sediment storage, soil density and emissions. The total CCS is the change in CCS via sedimentation corrected for greenhouse gas emissions from sediment (Boerema et al., 2016a). The change in CCS via sedimentation is calculated from the change in mudflat and marshes, sediment accumulation per year, soil density, suspended particulate matter and particulate organic carbon. For both methods, the output map shows the amount of CCS per year for the area of interest.

Step 4: Development of the Smartsediment tool

The quantification rules from Step 3 were integrated in a QGIS plug-in to make them easily available. The Smartsediment tool allows the user to calculate the impact of different sediment management strategies on the delivery of the ES and compare them with each other over a longer period of time. It has the following three functionalities:

  1. preparation of data layers;
  2. calculation of each of the selected ES separately; and
  3. analysis of the results (Figure 3).

As QGIS is open source software, others can easily use our tool without a licence. This considerably increases the applicability of the Smartsediment tool in the future. The tool consists of two parts, the actual plug-in and a GIS database. The first part, the QGIS plug-in, consists of the scripts that build the interface, and it integrates the quantification rules in a range of ES modules. The second part, the GIS database, consists of several folders needed to run the plugin. These folders contain ESspecific information and a location to store intermediate data during the calculations.

To run the ES calculations in the Smartsediment tool, information on a wide range of parameters is required. These parameters can be spatial maps or values that are consistent for the entire research area. The information can be derived from other conceptual and numerical models that can evaluate the impact of sediment management strategies on different estuarine characteristics such as hydrodynamics, sediment behaviour and others. An important parameter used in different ES calculations is a spatial description of the ecotopes. However, models or methods to calculate the ecotope map are not widely available. Therefore the tool comes with a module to calculate this map through other, usually more accessible, modelderived datasets such as current velocity and bed level.

ES often have complex relationships with many parameters. To accurately predict the impact of sediment management interventions on these ES, only specialised, numerical models can be used. However, this type of models and hence the broad range of specific data is not often available to the user, making it difficult to provide many of the required input parameters for the tool. To address this shortcoming, the ecotope map and other ES-specific data are used to calculate a range of ES. Wherever possible, the Smartsediment tool provides a multi-level approach. For some ES both a simple and a more complex calculation method is provided, allowing the user to choose the more appropriate method depending on data availability. When only one method is available, a minimal set of parameters is required. But, if more precise data is available, the tool allows this additional data to be added, which will improve the accuracy of the ES calculation. Additionally, spatial data are not always available for all parameters. If only one value is available for the entire area, this value can be provided to the module instead of a spatial dataset. Thus the Smartsediment tool offers users a great deal of flexibility, giving a first screening of effects with the available data and knowledge. This also results in the disadvantage that the quality of the prediction is highly dependent on the quality and detail of the given input data.

An intervention such as sediment nourishment results in a direct effect on the morphodynamics of the ecosystem, but through the processes between hydrology, morphology and ecology many indirect impact-effect relationships occur.

The delivery of ES is not static, especially in dynamic systems such as estuaries. To understand how ES delivery evolves, the user can evaluate each ES for four time periods in one calculation run. The outcome of each calculation is a map that gives a spatial representation of the ES delivery. However, maps are often difficult to compare, especially over a range of time periods and different ES. Therefore a specific tool, created with Microsoft Excel, is made available to aggregate the spatial data in total values and mean values per hectare and present them in different tables. These tables allow the user to better compare changes between different sediment management strategies and how these strategies will impact the delivery of ES over time. By aggregating the data for only the project area or the larger estuary, comparisons can also be made between local and estuarine effects.

Case study: Sediment nourishment of the Roggenplaat (Eastern Scheldt, the Netherlands)

The tool was tested for a range of SMART sediment management strategies in the transboundary Scheldt delta. Sediment nourishment of the Roggenplaat in Eastern Scheldt, the Netherlands is a good illustration.

Figure 4

Example of an ES calculator interface with the four types of information that are asked. Here the calculator interface for ES food resources from shellfish is shown: 1) The location of the ES-database and the area of interest for which the calculation should be done; 2) The time-step(s) for which the calculation has to be performed; 3) Data needed for the ES calculation for the different time-steps; and 4) The location where the results should be stored.

In the Eastern Scheldt, the hydromorphological balance was disrupted around 1980 due to the construction of the storm surge barrier and compartment dams as part of the Delta plan (see Nienhuis and Smaal, 1994). As the cross-section of the main channels was not in equilibrium with the tidal volume anymore a net transport of eroded sediment from the tidal flats towards the channels was observed. Due to this ‘sand starvation’, tidal flats were gradually disappearing under the water (de Ronde et al., 2013). This caused both available tidal flats and the feeding time for birds to strongly decrease. It was an undesirable effect because the preservation of these birds, in particular different types of wading birds, and benthic habitat is part of the European Habitat and Bird Directive targets. Eastern Scheldt is in fact a Natura 2000 area. Preventing erosion and sand hunger in this area is not possible because removing the storm surge barrier is not an option. Filling the channels, to moderate the sand hunger, would require too much sand. Therefore, management is orientated towards mitigating effects by elevating the tidal flats. One example is the heightening with nourishments of a part of the Roggenplaat in the north-eastern part of the Eastern Scheldt in the Netherlands (Figure 5). The aim is to preserve about 2,000 hectares of valuable intertidal area as a foraging area for the next 25 years (van der Werf et al., 2016). Additional points of attention in this region are the preservation of resting habitat for seals and prevent the southern coast of Schouwen from undesirable wave impact.

Figure 5

Picture of the Roggenplaat, located in the Eastern Scheldt in the Netherlands. Picture by Edwin Paree, Omroep Zeeland.

Scenarios and input data

To illustrate the functionality of the Smartsediment tool, the impact of four scenarios on the delivery of ES was simulated: the ‘Current (2016)’ and ‘Future (2030)’ both with and without nourishments. Regarding data input, we used monitoring that was performed in 2016, before the nourishment started (Ysebaert et al., 2016 and Ysebaert et al., 2017), and environmental impact assessment with appropriate assessment (Boudewijn, 2016). The following data were used for the calculations (de Ronde et al., 2013): bathymetry maps of the Eastern Scheldt, maps of the emersion time of the Eastern Scheldt, and a map of the maximum current velocity of the Eastern Scheldt. However not all parameters that are needed, as input data for the Smartsediment tool were available for the case-study, especially for the future situation as it requires thorough modelling to predict this. For those parameters, we added average numbers for the region or highly simplified estimates for grain size, water level, and productivity of fish, shellfish and crustaceans. As mentioned before, this allows flexibility for the user to use the tool in case of limited data, but obviously, when using such highly simplified input data, the output should be interpreted with great care.

Calculating the ecotope distribution

With the Smartsediment tool, ecotope maps were calculated for each scenario using the bathymetry, emersion and current velocity maps. The effect of the nourishment on the distribution of ecotopes appears to be limited (Figure 6). The expected scenario for 2030 is an increase of the shallow low-dynamic sublittoral area in comparison with 2016, both with and without the addition of nourishment. This area would originate from eroded lowdynamic middle-high littoral areas. Do note that the low dynamic middle-high littoral area is predicted to be larger in the scenario ‘Future (2030)’ if the nourishment is added. It seems therefore that the effect of the nourishment on the distribution of the ecotopes is more pronounced over the long term.

Calculating ES effects

For the following ES the tool offers a calculation method: food provision from shellfish, crustaceans, and fish, flood risk prevention, regulation of water quality, climate regulation, recreation and tourism from boating, habitat and species richness for seals and wading birds. Four scenarios, with and without nourishment, for the situation directly after the nourishment and in 2030, were input for a calculation of ES with the Smartsediment tool (Table 1).

This analysis helps to have a more integrated picture of the possible effects of this project and whether it can achieve its goal. The project is mainly designed to extend the availability of a suitable feeding area for birds and to secure it in the long term (by 2030). There was also attention paid to minimising the impact of the works on local mussel plots. The output suggests that indeed the objective of the project was achieved as the future area for birds would be higher with replenishment than without. With the nourishment put in place, the habitat for wading birds will initially disappear.

Figure 6

Ecotope distribution for the four different scenarios at the Roggenplaat and its immediate surroundings. Note the remarks on data uncertainty and limitations in the reflection section.

This is due to the burial of the macrobenthos community. In the future, the benthos will recover, leading to more foraging habitat than in the future scenario without nourishment (Figure 7). This is as expected and can be explained by the increased emersion time because of the nourishment (van der Werf et al., 2016). The Smartsediment tool predicts no effect of the Roggenplaat nourishment on the habitat for resting seals. Because the nourishment is carefully designed not to influence seal habitat, this outcome was as expected. Also, hardly any impact on shellfish is calculated. For water quality and climate regulation – two services that were not considered in the original project design but may be of additional importance –the nourishment does not seem to be important.

Figure 7

Suitability of the Roggenplaat as foraging habitat for wading birds (with 0, red = not suited and 1, dark blue = perfect habitat) for four scenarios: with and without nourishment, at present and in the future. Maps are calculated with the Smartsediment tool. The grey contours indicate where the nourishment was placed. Note the remarks on data uncertainty in the reflection section.

Such ES approach offers a much broader assessment of the project compared to the appropriate assessment (AA) (Boudewijn, 2016). The ES approach assesses in the first place the positive contributions of nature to society. In case a project results in the creation of new nature areas it will get a positive evaluation, while in case a nature area disappears the evaluation will be negative. In comparison, in an AA only the question whether a project is harmful for nature is addressed. In the AA of the Roggenplaat (Boudewijn, 2016) it was concluded that this project will not result in harmful consequences for the natural conditions of the potentially affected area (given the conditions stated in the permit, e.g. no nourishment within a buffer of at least 600 m from the center of the known seal resting area at the edge of the tidal flat). The ES approach shows also an improvement for birds but also additional positive effects on fish and crustaceans such as shrimps (Table 1). Hence, it demonstrates the positive added value.

Table 1

Calculated ES in the direct surroundings of the Roggenplaat nourishment for four scenarios. +++, ++ & + means an increase of at least 50, 20 & 10 % respectively compared to the Present (2016) scenario without nourishment. ---, -- & - means a decrease of respectively 50, 20 & 10 % and '=' indicates that there is less than 10% difference between the two scenarios. Numerical output is transformed into this trend indication because the high uncertainty of the input data. Note the remarks on data uncertainty and limitations in the reflection section.

Remarks and limitations

The Smartsediment tool was developed and tested for the transboundary Scheldt delta, but the conceptual model is generally applicable to estuaries and coastal areas with similar characteristics. The relationships between the ecosystem parameters and ES can be applied on other estuaries, although this would require adaptations for the local conditions. The calculation methods should be specified for the characteristics of the studied coastal zone these being the morphological conditions, discharge, nutrient load, species types, etc. Furthermore, the applicability of the Smartsediment tool is not limited to the evaluation of sedimentrelated measures. The evaluation method can also be used to assess other measures in estuaries such as changes in fresh-water management or changes in local discharges, such as for example cooling water.

The tool has some limitations. It is for screening and is not a numerical model. Since the tool pursues a broad scope of application, both large and small project areas as well as detailed and less detailed inputs, the level of detail created by the output cannot be limited in advance. Furthermore, it is important to note that the result of the simulation is largely determined by the assumptions made to generate the ecotope maps.

This analysis helps to have a more integrated picture of the possible effects of this project and whether it can achieve its goal.

The user should be aware that the reliability of the output is greatly dependent on the reliability and precision of the input data. One should be aware of the different levels of uncertainty linked to the input data as well as the provided calculation methods in the tool. The methods foreseen in the tool for individual ES are rather simple to ensure that data input requirements are not too high but leading to less precise outcomes. Furthermore, the effects of different ES on each other are not considered such as recreational activities that might disturb bird habitat. The tool can be used for a high-level comparison of scenarios with only high-level estimates as input, but then the output should also be considered as a high-level screening. When tool is used to assess future situations without extensive modelling beforehand it is difficult to predict exact realistic values, leading to an uncertain outcome of the calculations.

The output values given for the ES are not exact values but must be considered in a relative way to compare between sites and scenarios. Therefore, the results should always be interpreted by an expert with knowledge about the area of interest. As demonstrated for the Roggenplaat case (Table 1), the output can be translated into positive or negative trends or impact to prevent the exact number of outputs being given too much emphasis. This places the output more in line with the status of a screening tool, giving an indication of the influence of sediment measures so that decisions about further research or communication may be objectively analysed and evaluated to support decisions for further research and/or communication.

For more information or enquiries, please contact editor@iadc-dredging.com

Authors

Annelies Boerema
Annelies Boerema

Annelies specialises in ecosystem services research, combining a biophysical and economic evaluation of ecosystem management practices. Her background is in economics and environmental science. In 2016, she obtained a PhD in Environmental Science at the Ecosystem Management research group at the University of Antwerp in Belgium. Since 2020, she works as an advisor at IMDC, an international engineering and consultancy company in the field of natural waters.

OTHER ARTICLES BY THIS AUTHOR
Katrien van der Biest

Katrien van der Biest is a doctoral student at the Research Group Ecosystem Management of the University of Antwerp, Belgium. She obtained her Master’s degree in Physical Geography at the University of Ghent and her Master’s degree in Oceanography at the University of Liège, both in Belgium. Her current research focusses on quantifying and mapping ecosystem services as a supportive tool in environmental management, both in terrestrial and in marine ecosystems

OTHER ARTICLES BY THIS AUTHOR
Patrick Meire
Patrick Meire

Patrick Meire is professor in biology and head of the research group Ecosystem Management (ECOBE) at the University of Antwerp, Belgium. His research focusses on the environmental impact of human activities on aquatic and wetland systems and these insights are used to develop concepts for integrated water management and ecosystem management. In the Scheldt estuary he coordinates the OMES project that studies the environmental impact of the Sigma Plan (management plan for the Flemish part of the Scheldt estuary with a focus on safety, navigation and nature). He obtained his PhD in biology from the University of Ghent, Belgium.

OTHER ARTICLES BY THIS AUTHOR
Sofie De Swerdt

Sofie studied Environment, Health and Safety Management at the KU Leuven, Belgium. In 2019, she graduated from the Advanced Master of Science for Integrated Water Management at the University of Antwerp, Belgium, with a thesis on nourishment projects in the Eastern Scheldt in cooperation with the Royal NIOZ, in Yerseke, the Netherlands. Following her studies, she worked as a research assistant on the Interreg project Smartsediment for the Royal NIOZ, where she participated in the evaluation and application of the Smartsediment tool.

OTHER ARTICLES BY THIS AUTHOR
Marcel Taal

Marcel works in the Resilience and Planning division of the Marine and Coastal Systems unit of Deltares. He has over 20 years experience in providing knowledge on coasts and estuaries to policy and management in the Netherlands. He manages the implementation and also develops, together with representatives of the Dutch government, national knowledge programmes for the Dutch coast and the Scheldt estuary. Marcel previously worked for the Dutch government for six years, where, amongst others, he led the coastline management programme.

OTHER ARTICLES BY THIS AUTHOR
Dirk Vrebos

Dirk is a biologist by training and since 2009 has worked at the University of Antwerp, Belgium. In his doctoral thesis, he investigated relationships between land use, water quality and ecosystem services within a river basin in Flanders. Over the past 10 years, he has analysed, within national and international projects, the effects of policy and management on the delivery of ecosystem services in Flanders, Europe and Africa.

OTHER ARTICLES BY THIS AUTHOR
Frederik Roose

Frederik graduated from the University of Ghent, Belgium, as Bio-engineer in soil and water management and as Master of Marine and Lacustrine Sciences. Since 2006, he works as a project coordinator in the Environment Team of the Maritime Access Division of the Department of Mobility and Public Works in Flanders, Belgium. His projects are related to the development of the sediment management strategy in the Schelde estuary and how it affects the estuary’s morphology and ecology.

OTHER ARTICLES BY THIS AUTHOR
Sebastiaan Mestdagh

Sebastiaan trained as a marine biologist with a general interest in the interaction between humans and life in and on the seabed. He holds a Bachelor in Biology from the Catholic University of Leuven, Master of Marine and Lacustrine Science and Management from the Free University of Brussels and a Doctor of Marine Sciences from Ghent University. He has since worked at the Royal NIOZ, in Yerseke, the Netherlands where, in addition to the Smartsediment project, he worked for the DISCLOSE project, investigating the soil habitats of the North Sea.

OTHER ARTICLES BY THIS AUTHOR
Tom Ysebaert

Tom is a marine ecologist and expert on estuarine, deltaic and marine ecosystems, with special emphasis on the functional role of benthic ecosystems. He received his PhD degree in 2000 at the University of Antwerp, Belgium. He is currently senior researcher and adviser at Wageningen Marine Research and senior researcher within the Estuarine & Delta Systems department at the Royal Netherlands Institute for Sea Research in Yerseke, the Netherlands. He is also associated professor at the University of Antwerp, Belgium.

OTHER ARTICLES BY THIS AUTHOR